Hertzsprung-Russell Diagram

|
Are all stars the same? Not in the least! Some stars are just beginning to form in nebulae, others are enjoying middle age along the main sequence, and some have begun to die. The life cycle of a star can be compared to the life cycle of humans. Find out what stage you would be in if you were a star. The Hertzsprung-Russell Diagram is a tool that shows relationships and differences between stars. It is something of a "family portrait." It shows stars of different ages and in different stages, all at the same time. But it is a great tool to check your understanding of the star life cycle. Let’s go over the basics before we check your understanding.
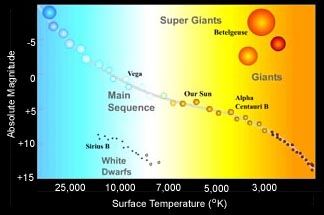
In the Hertzsprung-Russell (HR) Diagram, each star is represented by a dot. There are lots of stars out there, so there are lots of dots. The position of each dot on the diagram tells us two things about each star: its luminosity (or absolute magnitude) and its temperature. The vertical axis represents the star’s luminosity or absolute magnitude. Luminosity is technically the amount of energy a star radiates in one second, but you can think of it as how bright or how dim the star appears. Depending upon the textbook you use, the labels on the HR diagram could be a little different. Luminosity is a common term, as is absolute magnitude . Absolute magnitude is the intrinsic brightness of a star. In either case, the scale is a "ratio scale" in which stars are compared to each other based upon a reference (our sun). The horizontal axis represents the star’s surface temperature (not the star’s core temperature – we cannot see into the core of a star, only its surface)! Usually this is labeled using the Kelvin temperature scale. But notice : In most graphs and diagrams, zero (or the smaller numbers) exist to the left on the diagram. This is not the case here. On this diagram, the higher (hotter) temperatures are on the left, and the lower (cooler) temperatures are on the right. Some HR diagrams include the color of stars as they can be seen through filters on spectrophotometers. This is also a "ratio scale." So how do you read the HR diagram? Well, let’s look at some basic regions on it. A star in the upper left corner of the diagram would be hot and bright. A star in the upper right corner of the diagram would be cool and bright. The Sun rests approximately in the middle of the diagram, and it is the star which we use for comparison. A star in the lower left corner of the diagram would be hot and dim. A star in the lower right corner of the diagram would be cold and dim. Interactive LabLet’s see how good you are at reading the HR diagram. Click the diagram below, we have five stars. How would you describe the temperature of Star A? (Comparing the stars to each other) And how would you describe the luminosity (brightness) or Star A? Look at Stars B through E and describe each of them. 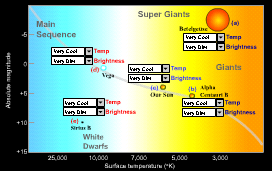
Are there any stars that seem out of place? For example, are there any stars that are really hot but not very bright? Are there any stars that are not very hot but they shine very brightly? What do you think could account for these differences in stars that do not fit the pattern? Stars that do fit the pattern are called main sequence stars. Let’s look at those before we deal with the exceptions. Most of the stars lie within a region called the main sequence. It looks kind of like a curved line sloping from the upper-left to the lower-right of the HR diagram. There are some stars that are not on the main sequence, but for now let’s concentrate on the main sequence stars. Why is there a main sequence region anyway? Well, there is a predictable relationship between the brightness and size of a star. This shows up on the HR diagram. We know that hotter things are brighter. A hotter temperature means that more energy is radiated into space. Bigger stars are brighter. A bigger surface area means that more energy is radiated into space. The sun is used as a reference, so let’s use some logic to figure out how this works.
|